Do you feel like the economy isn’t making a lot of sense right now?
Is there a mismatch between the headlines and your perception?
If so, you’re not alone.
There’s a big divide between the current data and the “vibes” many Americans are feeling.
Here’s what we mean — When you look at the data, the economy is actually looking pretty good.
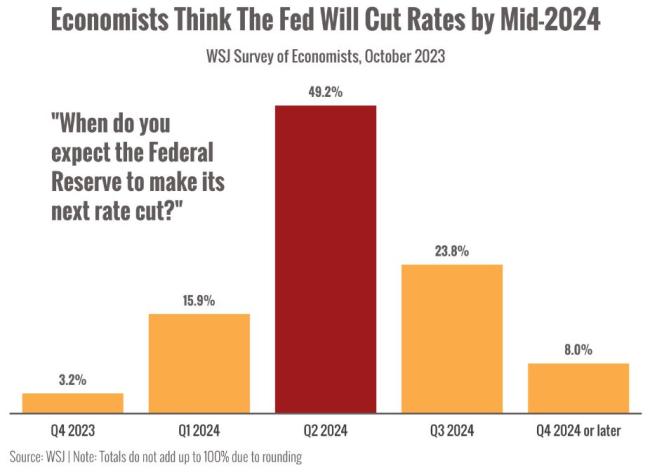
Many economists think the Fed will be able to cut interest rates by mid-2024.1
The labor market is surprisingly strong, adding 336,000 jobs in September, up significantly from the 200,000+ added in both July and August.2
Manufacturing, which slowed earlier in the year, looks to be rebounding as factory output rises.3
And Americans are still spending online, in stores, and in restaurants.2
Right when a lot of analysts worried we’d see a slowdown.
In fact, the estimates for Q3 economic growth look downright rosy.4
But why does it feel like the economy is teetering?
When it comes to the economy, the data and our perceptions often don’t match.
We think that’s for a few reasons.
👉 Humans come with an inborn negative bias. Our brains are wired with a "positive-negative asymmetry," which means we tend to remember negative news and react more strongly to negative stimuli.
👉 Our circumstances impact our perception. If you’ve gone through a layoff or are watching folks around you struggle, it’s going to give you a different perspective on the economy.
👉 We keep seeing headlines about the "uncharted waters" we're swimming in. The pandemic upended everything and we're still feeling the effects.
All told, there are a number of reasons why you might not feel positive about the economy.
There are definitely potential headwinds ahead for the economy. There always are.
The wars in Israel and Ukraine inject pain and uncertainty.
The excess savings Americans built up during the pandemic have largely been spent, which could slow future spending.5
The effects of high interest rates are still percolating throughout the economy. It’s not clear that we’ve seen the full effects yet.
A rising number of subprime borrowers are late with their loan payments.6
Bottom line: The U.S. economy is still going strong from where the data stands, but it's not surprising if the “vibes” don't match.
What's important is staying flexible and acting with confidence, not fear. And as always, we’re watching the data closely and we'll reach out with more information as needed.
Questions in the meantime? We’re here to help. Just hit "reply" to this email and we'll find a time to chat.
Until next week,
Your Eagle Wealth Team
P.S. Did you know there are all sorts of oddball economic indicators that some use to make predictions? Here’s a fascinating article about what plastic surgery (and other weird metrics) might tell us about the economy.
|
Halloween’s tomorrow — do you have your candy ready?

Did you know the National Retail Foundation projects Americans will spend a staggering $12.2 billion this Halloween? That's about $100 per household and amounts to a 15.5% increase in spending compared to last year's Halloween. And, out of the $12.2 billion, an impressive $3.6 billion will be spent on candy alone!7
What's changed? Celebrations like Halloween are exceeding even pre-pandemic levels. After being cooped up, we're all looking for a good excuse to spend more time with family and friends, even if that means spending more to have a festive celebration.
According to CandyStore.com, these are America's top favorite Halloween candies:
- Reese's Cups
- M&M's
- Hot Tamales
- Skittles
- Sour Patch Kids
- Starburst
- Hershey Kisses
- Candy corn
- Hershey Mini Bars
- Snickers8*
* Results from 15 years of sales data (2007-2022) from CandyStore.com
Did your favorite candies make the list? Will you be handing out candy to trick-or-treaters this year? And, for all the little ones asking, will you be handing out full-sized candy bars?
Wishing you and yours a most "ghoulishly" fun Halloween!
|
|

Caramel Apples
Prep Time: 15 mins
Cook Time: 30 mins
Additional Time: 1 hr 30 mins
Total Time: 2 hrs 15 mins
Ingredients
· 8 large tart apples
· 8 wooden chopsticks for handles
· 2 cups packed brown sugar
· 1 (14 ounce) can sweetened condensed milk
· 1 cup light corn syrup
· 1 cup butter
· 2 teaspoons vanilla extract
· Toppings such as mini chocolate candies, shredded coconut, crushed cookies or chopped nuts.
Directions
1. Bring a large saucepan of water to a boil. Dip apples in boiling water for a few seconds, using a slotted spoon, then dry with paper towels to remove any wax from the peels. Set apples aside to cool completely, about 30 minutes.
2. Insert sticks into the bottom of each cooled apple through the core for a handle.
3. Line a baking sheet with parchment paper.
4. Stir brown sugar, sweetened condensed milk, corn syrup, and butter together in a saucepan over medium-high heat. Bring to a boil, stirring constantly, then reduce heat to medium. Cook until a candy thermometer reads 248 degrees F (120 degrees C), stirring constantly to prevent burning, about 25 to 30 minutes. A teaspoon of caramel dropped in a glass of cold water, should form a firm ball. Remove caramel from heat and stir in vanilla extract.
5. Working quickly, dip each apple into the hot caramel to completely coat the apple and about 1/2 inch of the wooden handle. Sprinkle apples with any desired toppings while still hot. Let caramel apples cool on the prepared baking sheet, about 1 hour. Use caution, caramel is very hot.
Source: https://www.allrecipes.com/recipe/228210/the-best-caramel-apples/

The Week on Wall Street
Amid a busy week of corporate earnings reports, stocks slumped on cautious earnings guidance, fears of higher interest rates, and growing anxiety over the increasing amount of Treasury bonds and notes coming to market.
The Dow Jones Industrial Average dropped 2.14%, while the Standard & Poor’s 500 declined 2.53%. But the Nasdaq Composite index gave up 2.62% for the five trading days. The MSCI EAFE index, which tracks developed overseas stock markets, added 0.19%.9,10,11
October Slide Continues
Stocks continued their slide last week despite mostly better-than-expected earnings results. While earnings surprises were generally positive, investors were troubled by declines in year-over-year net profit margins and tepid earnings guidance. Particularly hard hit were technology companies, following mixed earnings results.
Economic data released on Thursday showed remarkable economic strength, with above-consensus forecast growth in third-quarter Gross Domestic Product (GDP) and September’s durable goods orders, with only a minor uptick in initial jobless claims. The results fanned worries that the Fed might need to hike rates further or, at least, maintain high rates for longer.
Strong Economic Data
The first read of third-quarter economic growth was a blowout, with GDP increasing at an annualized rate of 4.9%. This pace was well ahead of the prior quarter’s 2.1% expansion and above consensus forecasts. Powering the third quarter’s economic performance was strong consumer spending and inventory build-up.12
Durable goods orders jumped 4.7% in September, confirming the nation’s continued good economic health, easily outpacing the 0.1% rise in August and economists’ forecast of two percent. Meanwhile, initial jobless claims slightly increased, suggesting that the labor market remains healthy.13
|
|


Any companies mentioned are for informational purposes only, and this should not be considered a solicitation for the purchase or sale of their securities. Any investment should be consistent with your objectives, time frame, and risk tolerance
|
1. https://www.wsj.com/economy/a-recession-is-no-longer-the-consensus-3ad0c3a3
2. https://www.wsj.com/economy/the-economy-was-supposed-to-slow-by-now-instead-its-revving-up-3c0f7a2e
3. https://www.federalreserve.gov/releases/g17/current/default.htm
4. https://www.atlantafed.org/cqer/research/gdpnow
5. https://www.frbsf.org/economic-research/publications/economic-letter/2023/may/rise-and-fall-of-pandemic-excess-savings/
6. https://www.businessinsider.com/more-people-missing-car-payments-another-ominous-sign-for-economy-2023-10
Chart source: https://www.wsj.com/economy/a-recession-is-no-longer-the-consensus-3ad0c3a3
7. NRF.com, 2023
8. CandyStore.com, September 30, 2023
9. The Wall Street Journal, October 27, 2023
10. The Wall Street Journal, October 27, 2023
11. The Wall Street Journal, October 27, 2023
12. CNBC, October 26, 2023
13. CNBC, October 26, 2023
Investing involves risks, and investment decisions should be based on your own goals, time horizon, and tolerance for risk. The return and principal value of investments will fluctuate as market conditions change. When sold, investments may be worth more or less than their original cost.
The forecasts or forward-looking statements are based on assumptions, may not materialize, and are subject to revision without notice.
The market indexes discussed are unmanaged, and generally, considered representative of their respective markets. Index performance is not indicative of the past performance of a particular investment. Indexes do not incur management fees, costs, and expenses. Individuals cannot directly invest in unmanaged indexes. Past performance does not guarantee future results.
The Dow Jones Industrial Average is an unmanaged index that is generally considered representative of large-capitalization companies on the U.S. stock market. Nasdaq Composite is an index of the common stocks and similar securities listed on the NASDAQ stock market and is considered a broad indicator of the performance of technology and growth companies. The MSCI EAFE Index was created by Morgan Stanley Capital International (MSCI) and serves as a benchmark of the performance of major international equity markets, as represented by 21 major MSCI indexes from Europe, Australia, and Southeast Asia. The S&P 500 Composite Index is an unmanaged group of securities that are considered to be representative of the stock market in general.
U.S. Treasury Notes are guaranteed by the federal government as to the timely payment of principal and interest. However, if you sell a Treasury Note prior to maturity, it may be worth more or less than the original price paid. Fixed income investments are subject to various risks including changes in interest rates, credit quality, inflation risk, market valuations, prepayments, corporate events, tax ramifications and other factors.
International investments carry additional risks, which include differences in financial reporting standards, currency exchange rates, political risks unique to a specific country, foreign taxes and regulations, and the potential for illiquid markets. These factors may result in greater share price volatility.
Please consult your financial professional for additional information.
This content is developed from sources believed to be providing accurate information. The information in this material is not intended as tax or legal advice. Please consult legal or tax professionals for specific information regarding your individual situation. This material was developed and produced by FMG Suite to provide information on a topic that may be of interest. FMG is not affiliated with the named representative, financial professional, Registered Investment Advisor, Broker-Dealer, nor state- or SEC-registered investment advisory firm. The opinions expressed and material provided are for general information, and they should not be considered a solicitation for the purchase or sale of any security. Copyright 2023 FMG Suite.
|
|
|
|